
AFM
> How does it work ?
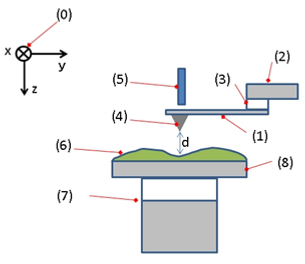
The atomic force microscopy is a technique based on the movement of a lever equipped with a nanoscopic needle the interacting with the surface of the analysed sample. Resulting measurements are images of height variations (topography) and phase variations, which can be represented in the form of 3D models [1-4]. A scheme of this method is represented on Figure 1.
As the central part of this method, the nanoscopic tip is made out of silicon nitride (Si3N4), being a chemically inert and very hard material [5]. The diameter of the pic varies from some to about ten nanometers, leading to a lateral and vertical resolution for in air measurements of 30 Å and 1 Å respectively [3].
Concerning the detector, it is delivering electrical intensity signals proportional to the movement of the lever. There are several detection methods like the interferometer, the optical lever, the piezoresistive method and the piezoelectric method. For the optical lever, a laser measures is focused on the lever and measures its movements.
Because the movement of the lever comes from the interactions of the tip with the sample surface, AFM can also be used to measure a large range of interactions like mechanical forces, van der Waals interactions, capillary forces, chemical bonds, electrostatic interactions, magnetic forces and others. That broad range of analyzed interactions makes AFM a powerful and versatile tool for the study of a lot of systems.
As for the detector, there is a variety of capture modes can be applied when performing AFM. The most frequently used mode is the “tapping mode”. In this mode the tip is placed very close to the surface of the sample and it vibrates at a frequency close to its resonance frequency. When displaced on the surface, intermittence contacts are happening and variation of the vibration amplitude and phase are measured. Interpretation of those variations gives information about short distance interactions like van der Waals and dipole-dipole are measured as well as mechanical resistance.
Figure 1 : AFM Schematic representation. A lever (1) mounted on a support (2) and attached with a piezoelectric element (3) is equipped with a nanoscopic tip (4). The detector (5) measures the movement of the lever whose tip is interacting with a flat sample (6) and transforms it in an electric signal which is sent to a computer for interpretation. The sample can be moved in the three spatial directions (0) due to a support and is usually a thin film on a substrate (8). From [1].
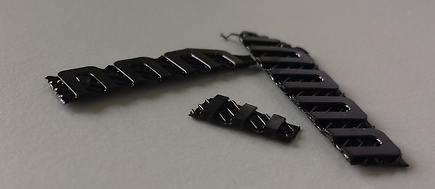
Figure 2: Pictures of the samples used.
Measurements were made on Bruker’s Dimension FastScanTM Atomic Force Microscope, using the optical lever as detection method.[6] The sample used is a flat piece of raft material, a left-over after a FDM print with Flexifil, as shown on Figure 2.
> Experimental results on Flexifil
1. Atomic-force microscopy. Wikipedia, the free encyclopedia (2016).
2. Geisse, N. A. AFM and combined optical techniques. Mater. Today 12, 40–45 (2009).
3. Binnig, G., Quate, C. F. & Gerber, C. Atomic Force Microscope. Phys. Rev. Lett. 56, 930–933 (1986).
4. Chen, X. et al. Interpretation of tapping mode atomic force microscopy data using amplitude-phase-distance measurements. Ultramicroscopy 75, 171–181 (1998).
5. Silicon nitride. Wikipedia (2017).
6. Bruker: Dimension FastScan - Learn more. Bruker.com Available at: https://www.bruker.com/products/surface-and-dimensional-analysis/atomic-force-microscopes/dimension-fastscan/learn-more.html. (Accessed: 7th May 2017)
7. Przybytek, A., Kucińska-Lipka, J. & Janik, H. Thermoplastic elastomer filaments and their application in 3D printing. Elastomery 20, (2016).
8. On the Phase Diagram for Microphase Separation of Diblock Copolymers: An Approach via a Nonlocal Cahn--Hilliard Functional - Semantic Scholar. Available at: /paper/On-the-Phase-Diagram-for-Microphase-Separation-of-Choksi-Peletier/1935bb6d7bb27be2eba0bb86659e8c9bac85cdb0. (Accessed: 7th May 2017)
9. Wang, X., Goswami, M., Kumar, R., Sumpter, B. G. & Mays, J. Morphologies of block copolymers composed of charged and neutral blocks. Soft Matter 8, 3036–3052 (2012).
10. Ward, M. D. & Horner, M. J. Structure and order in soft matter: symmetry transcending length scale. CrystEngComm 6, 401–407 (2004).
> Bibliography
By Arthur


This choice of sample material was based on the fact that AFM requires very flat surfaces, because the maximum height usually measured in AFM is in the order of 10-20 µm,[1] The results of the analysis are presented in Figure 3 and 4. What can be said about Figure 3 is that the topographic images (3a and 3c) are corresponding to their respective phase image (3b and 3d). Additionally, that there are at least two immiscible phases present at the surface of the material. This supposes that the Flexifil polymer is a two-phased material and not a blend, which is also suggested by the literature [7]. Our analysis shows a homogeneous matrix containing a dispersed phase with various grain sizes, which would suggest that this material is copolymer. The observed structure corresponds to the structure described in the Flexifil page, in which the hard segments rearrange to form small grains, dispersed in a continuous soft phase. Other analysis realized in this project (DSC and FTIR) suggested a copolymer based on poly(butylene terephthalate) (PBT) and poly(tetramethylene glycol) (PTMEG). However, Flexifil is not a block-copolymer, in which case the observed phase separation observed would have been more regular with specific surface morphology visible (dots, stripes, terrasses)[8-10].
As mentioned in the description of the Flexifil, this material is semi-crystalline with a glass transition temperature (Tg) of 54°C and a melting temperature of 180°C. The elastomeric properties can be explained by the fact that the matrix is an amorphous material with a low Tg (maybe around -40°C). The dispersed phase is a crystalline material with high melting point used to improve the mechanical properties of the polymer.
Figure 3: 2x2µm AFM measurements at two different locations on the surface of the Flexifil filament sample. (a, b) are from the first measurement, (c, d) from the second. (a,c) are topographic images, whereas (b, d) are phase images.
Figure 4: 3 dimensional representation of the topographic images. (a) is the image of the first measurement and (b) of the second one.
To conclude, Flexifil is a two-phased copolymer. A macrophase separation is observed, with the matrix supposed to be the flexible material with a low Tg and the dispersed phase the solid material. This could explain the high flexibility of the material combined with the toughness and process-ability of a more rigid material. Despite intensive researches in the literature, the exact composition of this polymer remains not precisely defined.