
DSC
> Introduction
>> Bibliography
[2] Paul C. Hiemenz, Thimoty P. Lodge, Polymer Chemistry, Second Edition, CRC Press, London, 2007
[7] Jin Zhu, Yufei Hu, Yijing Tang, Biao Wang, Effects of styrene–acrylonitrile contents on the properties of ABS/SAN blends for fused deposition modeling, Journal of applied polymer sciences, 2016
[8]HIDE0 KUBOTA Flow Properties of ABS (Acrylonitrile-Butadiene-Styrene) Terpolymer, JOURNAL OF APPLIED POLYMER SCIENCE VOL. 19, PP. 2299-2308 (1975)
[9] Xiaojun Wei, Dong Li, Wei Jiang, Zheming Gu, Xiaojuan Wang, Zengxing Zhang & Zhengzong Sun, 3D Printable Graphene Composite, Scientific Reports 5, Article number: 11181 (2015)
[10] N. Makhiyanov and E. V. Temnikova, Glass Transition Temperature and Microstructure
of Polybutadienes, Polymer Science, Ser. A, 2010, Vol. 52, No. 12, pp. 1292–1300.
[11] Mettler Toledo Selected Applications, Thermal Analysis of Polymers,Handbook, http://us.mt.com/dam/LabDiv/Campaigns/gp/gtap/thermal_analysis_of_polymers_en.pdf
[12] Informations for user of METTLER TOLEDO thermal analysis systems http://www.masontechnology.ie/x/Usercom_11.pdf
[13] FlexiFil Technical Data Sheet, FormFutura, https://static.webshopapp.com/shops/021593/files/053156996/tds-flexifil.pdf?_ga=1.125532746.1175835800.1489487523, accessed on 24.04.2017
[14] Sithiprumnea Dul, Luca Fambri, Alessandro Pegoretti, Fused deposition modelling with ABS–graphene nanocomposites, Composites Part A: Applied Science and Manufacturing, Volume 85, June 2016, Pages 181-191, ISSN 1359-835X, http://doi.org/10.1016/j.compositesa.2016.03.013.
(http://www.sciencedirect.com/science/article/pii/S1359835X16300306)
[15] Rytlewski, P., Moraczewski, K., Żenkiewicz, M. (2014), Effects of coffee on the stability of accelerated aged poly(acrylonitryle-butadiene-styrene). J. Appl. Polym. Sci., 131, doi: 10.1002/app.39887
[16]T. F. Reed, H. E. Bair, R. G. Vadimsky, The Causes of Pitting and Haze on Molded ABS Plastic Surfaces, Chapter 15 in
Recent Advances in Polymer Blends, Grafts, and Blocks, 1974, Springer US,
Volume 4 of the series Polymer Science and Technology pp 359-373
> FlexiFil
Like for the ABS polymer, two DSC experiments were performed on FlexiFil samples : one on the filament before printing and one after printing. The results of the DSC before printing are available on the Figure 3.
The first part of the graph, situated at the left of the blue dashed curve, corresponds to the cooling of the samples and does not have to be taken into account. Our analysis begin approximatively after 14min, at more or less – 70 °C.
Two Tg, characterized by a change in the slope of the heat flux curve, can be found on the graph : one at about -44°C , and one other around 52 °C. The first Tg is the glass transition of the amorphous regions of the polymer (corresponding to the soft PTMO blocks of the chains). The second Tg, around 52°C, corresponds to the glass transition of the PBT component (hard blocks).
Finally, the melting temperature is observed around 182°C by an endothermic peak (red arrow), which corresponds to the Tm reported by the FlexiFil manufacturer. It corresponds to the melting of the crystalline phase, represented by the nodules composed of the PBT hard blocks. [13]
We also performed a DSC analysis on the FlexiFil after printing with the 3D printer. As can be seen on the Figure 4, no major differences can be observed between the curves. Small differences in the heat flow magnitude are observed. The two glass transitions mentioned above for the PBT and PTMO roughly happen at -44°C and 48°C, respectively. The melting temperature of the crystalline phase does not vary from the one found before printing the FlexiFil.
DSC, for Differential Scanning Calorimetry, is a thermal analysis method of polymers and is a technique that measures the heat flow of samples as a fonction of temperature or time. The heat flows to and from a sample and a reference material as the sample is heated or cooled. The obtained signal is the energy absorbed by or released by the sample, in milliwatts. This way, the DSC allows physical transitions and chemical reactions to be quantitatively measured. Endothermic and exothermic effects are detected, peak areas (transition and reaction enthalpies) can be measured as well as the specific heat capacity and the temperatures that characterize a peak or others effects. [11]
In order to perform a DSC analysis, a small quantity of the sample is confined within an aluminium pan and subjected to controlled temperature variations. A reference material is placed in an equivalent pan and the two pans are heated simultaneously. The temperature of the two pans are monitored continuously and the rate of heat flowing to the sample is adjusted to keep the temperatures of the two pans equal. Whenever the sample undergoes a thermal transition, the DSC registers both the amount and the direction (endo- or exothermic) of the additional heat flow. [2]
A typical curve of heat flow obtained by a DSC analysis is observed on Figure 1, while Figure 2 presents schematically a DSC device.


Figure 2 : Representation of a differencial calorimetry device. The sample (S) and the reference sample (R) are placed in two aluminium pans, and are heated (or cooled). The temperature is registered, as well as the heat flow to and from the sample of interest. [2]
Figure 1 : Typical DSC curve for a polymer that presents a glass transition, a crystallisation and a melting temperature. Schematic illustration of heat flow into the material versus temperature, showing the glass transition Tg, crystallization Tc, and melting Tm. [2]
By Grégoire
By Elisabeth
By Grégoire
> ABS
A first DSC was performed on a piece of filament before printing. This resulted in the following curve.
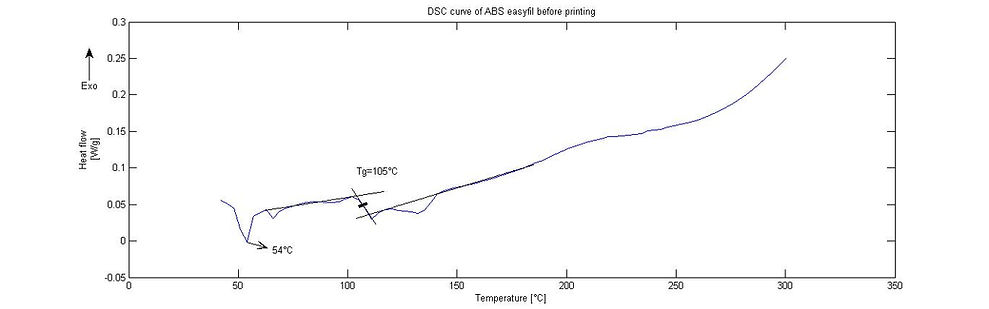
On the DSC curve, a glass transition can be found at 105°C. This corresponds to the value found for ABS (106°C [7] [9]). This glass transition is due to the component SAN whose Tg is 108°C. [7] The glass transition of the poly(butadiene) cannot be observed on this curve since it is between -115 and -95°C [10] and the DSC analysis started at room temperature.
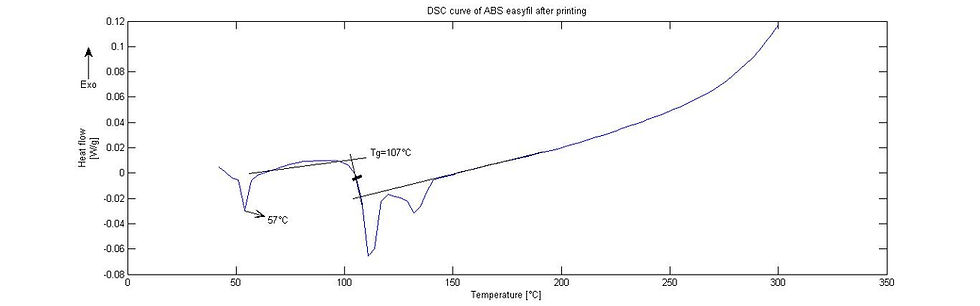
The DSC analysis has also been performed on a ABS sample after printing.
The glass transition is again around 106°C. However, this time, an enthalpic relaxation (endothermic peak) is observed. This is due to the fact that the sample has been stored, for a while, at a temperature below the glass transition temperature (physical aging).[11]
Regarding the endothermic peak just after 50°C, it appears before and after printing the ABS. So, there are two hypothesis: either it is a reproductible artefact, or its is linked to ABS. A possible reproductible artefact is the burst of the lid due to vapor pressure. However, a hole was made in the lid, so this should not happen. If it is linked to the polymer, it can be the melting of an additive.[12]
Around 135°C, for both curves, a small endothermic peak can be noticed. This could indicates an evaporation (through the hole in the lid). This can be verified by TGA since there would be a mass loss.[12] TGA results do not show any mass loss. Another hypothesis suggested by Rytlewski and al [15] is the melting of acrylonitrile AN crystallites. Nevertheless, according to Dul and al [14] this hypothesis is wrong, they suggest the melting of mould lubricant which is commonly added to ABS to have a better processing. This hypothesis is also supported by Reed and al. [16]
In conclusion, 3D print ABS does not change its thermal properties such as glass transition temperature.
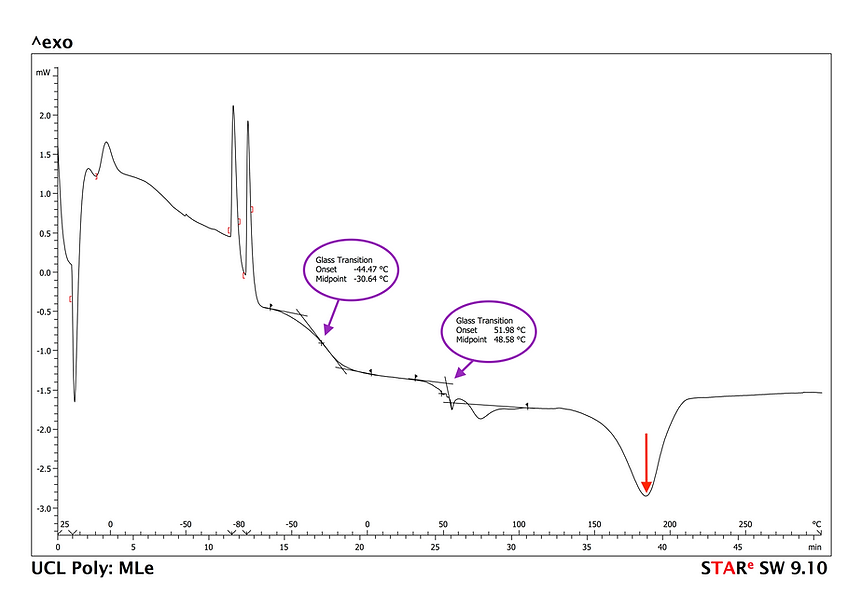

Figure 3: DSC measurements on FlexiFil samples before printing. The interesting part of the curve is situated at the right of the blue dashed line, the part situated at the left corresponding to the cooling of the samples.
Figure 4: DSC measurements on FlexiFil samples after printing. The interesting part of the curve is situated at the right of the blue dashed line, the part situated at the left corresponding to the cooling of the samples.
In conclusion, taking into account the errors made during drawing the base lines, it seems that the thermal properties of the FlexiFil are not modified after the printing of the filaments, which is an advantage for the use of FlexiFil in the drone.