Mechanical Tests
> Tensile test : Experiments and Results
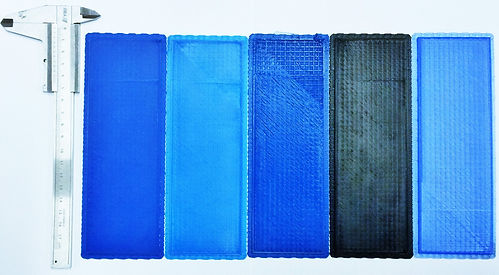
Different tensile tests at 120°C were performed to analyse the mechanical properties of ABS and Flexifil. This temperature, which is the maximal operating temperature of the drone, was used in order to see if the drone would withstand mechanical stresses at this temperature. Two tensile tests on the ABS before and after its printing were done. This allowed us to compare its mechanical properties before and after printing. The Flexifil, in turn, was only tested after printing. The 3D printed samples were dogbones which standardized dimensions can be found in Table 1.
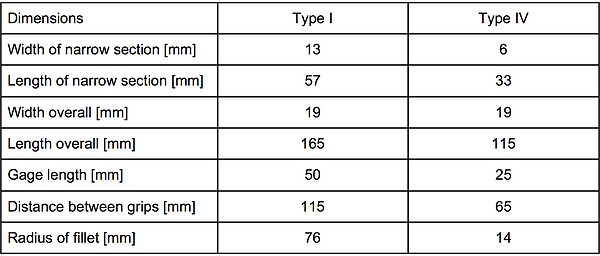
Table I : Dimensions of the dogbones.
Before the beginning of each test, the two edges of the sample were placed in the grips of an universal testing machine. These grips were installed in a furnace chamber heated to 120°C, as can be seen on Figure 1. After that, the elongation was achieved with a moving speed of 1 mm/s during the first 10 minutes, and then increased to 50 mm/s. The applied force was recorded by the device and the change in gauge length was measured by an extensometer. To obtain the mechanical properties of the samples, the stress-strain curves were drawn.
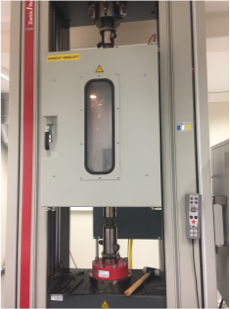
Figure 1 : Tensile machine with furnace chamber.
>> Printed FlexiFil
One tensile test on the Flexifill was realized. For this experiment, the sample was printed as a dogbone of type IV which dimensions can be seen in Table 1. The resulting curve can be seen on Figure 2. Thanks to these results, the mechanical properties were calculated and can be found in Table 2.
First, the elastic part can be observed. It corresponds to the linear part of the curve where the deformation of the specimen stays elastic (uniform and reversible). Its Young modulus, which corresponds to the slope in this area, is calculated as can be seen in Table 2 and is 21.31 MPa at 120 °C. However, a value of 24 MPa in standard conditions can be found in the literature [1]. Indeed, the Young’s modulus decreases with the temperature. This is due to the fact that the length of the bond between the atoms increases (because of thermal expansion). Therefore, the force to break these bonds decreases. This means that a smaller force is needed for the same deformation, so the Young’s modulus is smaller too.
Then, the yield strength is reached, the deformation becomes permanent and it corresponds to the stress at the entrance in plasticity. In this region of the curve, the deformation is uniform and irreversible.
The experiment could not be completed because of the limited size of the oven chamber. Indeed, no rupture happened as can be seen on Figure 3a. However, the surface of the specimen splits in two (as can be seen on Figure 3b) because of the bad printing. This can explain the decrease in the curve. But no conclusion on the tensile strength can be drawn. However, it can be observed that a really large deformation (300 %) can be handled by the dogbone and the technician told us that it could continue to elongate for a while (due to the appearance of the dogbone at the end of the experiment as can be seen on Figure 3a). An elongation at break of 530% in standard conditions can be found in the literature [1]. The experiment does not contradict the literature.
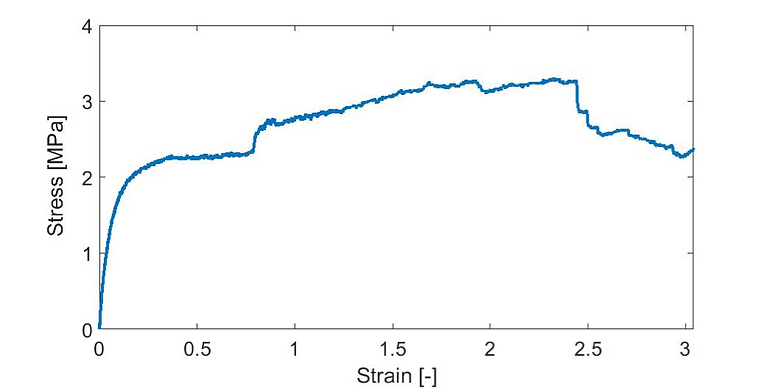
Figure 2 : Graph of the stress [MPa] in function of the strain [-] for the Flexifil after its printing.
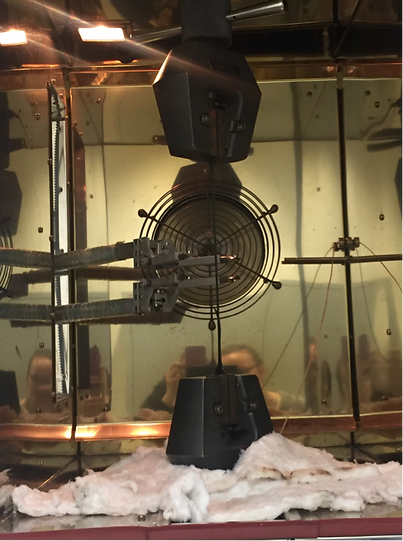
Figure 3a : Flexifil at the end of the experiment in the heat chamber.
>> Printed ABS
Another tensile test was performed on a sample of printed ABS which is a dogbone of type I (see table 1). In the same way than the FlexiFil, the dogbone was attached to the grips of the test machine and heated up to 120°C as can be seen on figure 4. In order to represent as close as possible the drone characteristics, the dogbone was printed using an infill of 50%, and the infill geometry used is diamond.
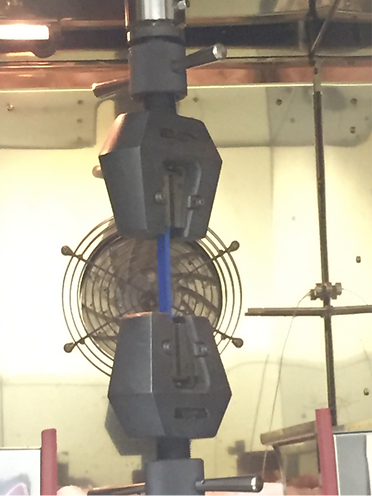
Figure 4 : ABS dogbone type at the beginning of the experiment.
The experimental curves stress-strain obtained are depicted on figure 5. As can be seen, two graphs are needed in order to represent the total curve. Indeed, due to the high length of the dogbone and its capacity to withstand relatively high strain, the bottom jaw reached the lower side of the oven chamber. This way, the dogbone was not able to be stretched out more. In order to reach the breaking point of the sample, the technician stopped the experiment and removed a part of the grips to allow the bottom jaw to continue the experiment. The experiment stopped when the jaws touched for a second time the upper and lower sides of the testing machine. At this time, the strain was about 47% and the dogbone didn’t break. It is not possible to obtain the breaking strength. The dogbone only breaks after the experiment. It is probably due to the relaxation of the chains.
The experimental values of the mechanical parameters can be extracted from the stress-strain curves (see Figure 5) : Young's modulus = 556.6 MPa, the yield strength = 0.34 MPa.
However, even though the goal of this test was to characterise the mechanical properties of ABS after 3D printing, it seems that due to the 50% infill and the diamond infill geometry we are not able to determine the material properties. Indeed, due to these two factors, the results obtained for the properties are dependent of the dogbone structure. As an illustration, the dogbone fracture presents an unexpected shape compared to that usually obtain. It can be clearly seen that the dogbone preferentially localised the deformation at some points along the gage, see Figure 6 left. After analysis, it seems that the dogbone broke at places where the cross-section presents the higher amount of void, see Figure 6 right. So, Young’s modulus and yield strength obtained are only valid for this specific infill and this structural geometry. Actually, the test we performed on this dogbone can be seen as determining the properties of a fictive material that would present an infill of 50% and a diamond structure.
As a conclusion, due to the 50% infill and the inner dogbone diamond structure, we cannot determine the properties of the printed ABS. However, the results obtained can be used in order to determine some of the mechanical properties of the drone structure.
Figure 5 : (left) Data from the first part of the tensile test. (right) Data from the second part of the tensile test.

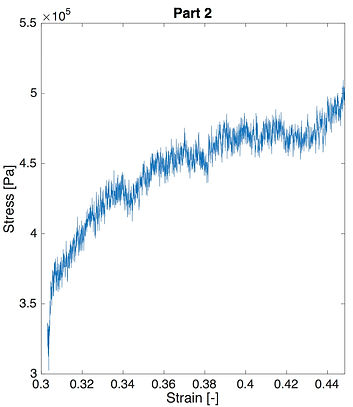


Figure 6 : dogbone shape after breaking (left) and aspect of the inner section of the dogbone (right). Due to the 50% infill of the dogbone, the section is not uniform at all. The dogbone fracture where the cross-section presents the high amount of void.
>> Non-printed ABS
The last tensile test was performed on the ABS before 3D-printing. As the sample was a filament with diameter of 1.75 mm, the assembly of the machine was different. As can be seen on figure 7, the specimen was winded and attached to disk-shaped grips. As the furnace chamber was too small to obtain a large elongation, the ABS was first heated to 120°C and then removed of the chamber to carry out the experiment. The resulting stress-strain curve can be observed in figure 8 and the calculated mechanical properties are summarized in table 2.
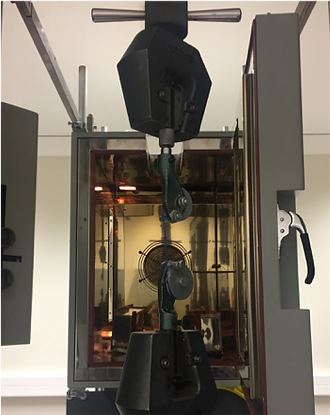

Figure 7 : ABS filament at the beginning of the test.
Figure 8 : Graph of the stress [MPa] in function of the strain [-] for the ABS before printing.
The linear part of the curve is first examined, which correspond to the elastic behaviour of the polymer. Its Young’s modulus is obtained to be 83 MPa. In the literature, the value of approximately 2 GPa is found at ambiant temperature [2]. As in the case of the Flexifill, it can be explained because the length of the bond between the atoms increases with temperature and so the force to break the bounds decreases. However, this large difference can also be justified by the sudden decrease of temperature at the beginning and by the imprecisions of the measurments due to the particular shape of the sample, which is not a standardised dogbone adapted for the tensile machine.
After the elastic linear zone, a peak is reached. This point corresponds to the yield strength of the material, where the deformation starts to be permanent, but also to the necking appearance. Indeed, at this value of 10.4 MPa, the deformation starts to localise in one place of the sample, due to the alignment of the chains. Following this point, this localisation propagates on all the length of the sample. However, as can be seen on figure 9, the entire striction and the break of the specimen could not be observed because the size of the tensile machine was still too small and the experiment was stopped. The elongation at the end of the experiment is 75 %, which is higher than the maximum 50 % found in literature [2]. This can also be justified by the shape of the sample which is not standardized.
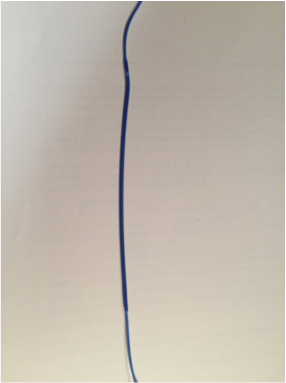
Figure 9 : ABS filament at the end of the test. The necking can be observed at the edges of the sample
> Mechanical properties of the drone
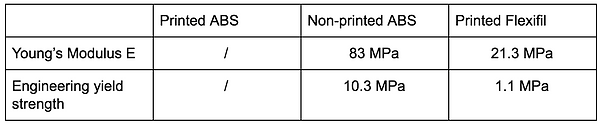
Table 2 summarises the calculated mechanical properties for each experiment. The Young’s Modulus is the proportionality factor between the applied stress and the resulting strain. The higher it is, the more rigid the polymer is. The lower value obtained for the Flexifill means that it is a compliant material and that a small stress will largely deform it elastically.
As explained in the section for the printed ABS, we are not able to extract values for the mechanical properties of the printed ABS due to the 50% infill and the diamond structure. This way, it is not possible to compare the properties of the ABS before and after printing.
However, the mechanical properties obtained in the printed ABS section are usable to characterise the drone structure.
Table 2 : Mechanical properties of the printed ABS, the non-printed ABS and printed Flexifil.
With some approximations on the geometry of the drone, the use of the beam theory and knowing that the total mass of the drone and the electrical part is 150 g, it is possible to estimate the stress on the drone when it is flying. The following development is based on the appendix B of the Ashby’s book [4].
First, as can be seen on the figure 10, the geometry of the flying drone is approximated as a beam embedded in both edges with a constant force in the middle. This assumption is based on the fact that the motors of our drone are contained in a square box in the center, which base supports most of the mass. The beam has a length L = 0.055 m, and its section is a rectangle with dimensions h = 0.005 m and b = 0.055 m.
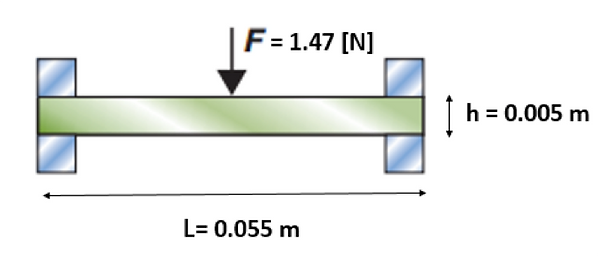

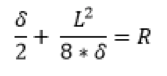
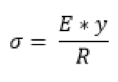
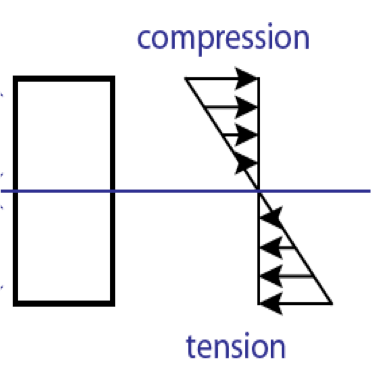
Figure 10 : Approximation of the geometry of the drone [4].
After that, knowing that the applied force F is 0.150*9.81 = 1.47 [N], it is possible to find the maximum elongation using equation 1, equation 2 and the Young’s Modulus calculated for the printed ABS. The obtained value is 0.019 mm.
Equation 1
Then, the deflection can be linked to the curvature radius using trigonometry [5]. The equation 3 is obtained giving R = 192.5 m.
Equation 3
Equation 2
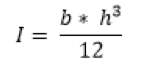
Finally, this radius can be connected to the maximum stress in the section of the beam, using y = h/2, the distance to the center of the cross-section (neutral fiber). Indeed, as shown in figure 11, the stress distribution in a bending beam is a compression in the inner half of the beam and a tension in the outer part, with stress linearly increasing to be maximal at the outer surface. The equation 4 is used to calculate this maximal stress, which is found to be 147 Pa. This is much lower than the measured yield stress, meaning that the flight of the drone will not cause any permanent deformation to the printed ABS material.
Equation 4
Figure 11 : Stress distribution in a bending beam.
[1] Datasheet Flexifil, Form Futura, http://www.stampantitalia.com/assets/flexifil---technical-product-data-sheet.pdf, accessed on 27/04/2017.
[2] Material properties, MakeItFrom http://www.makeitfrom.com/materil-properties/Acrylonitrile-Butadiene-Styrene-ABS,
accessed on 28/04/2017
[3] J. Cantrell, S. Rohde, et al. Experimental Characterization of the Mechanical Properties of 3D-Printed ABS and Polycarbonate Parts, http://cimar.mae.ufl.edu/rapid_proto/pages/3D%20Printing%20Paper%20Final%20Manuscript.pdf, accessed on 29.04.2017
[4] M. F. Ashby, Materials Selection in Mechanical Design, Fourth Edition, United States, Elsevier, BH, 2011, 646 pp.
[5] SARL Alco Cintrage, Calculez le rayon d’un tableau, http://www.alcocintrage.com/fr/page/calcul-rayon, accessed on 28/04/2017
> Bibliography
By Julie, Marine & Grégoire
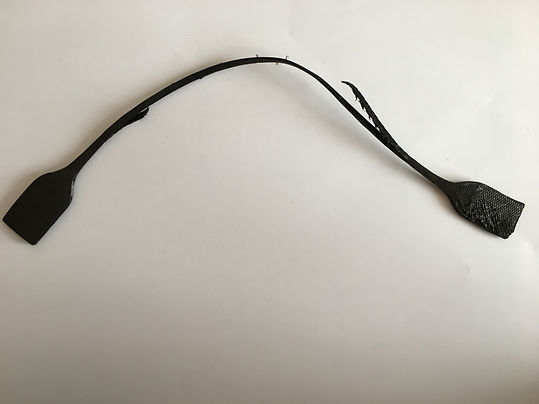
Figure 3b : Flexifil at the end of the experiment out of the heat chamber.